booldata exhibited at Future Labs Live Basel 2026 on 27 and 28 May at the Congress Center Basel, Switzerland, booth S13. Our focus was simple: show how fragmented lab data from LIMS, ELN, instruments and ERP can become one governed, decision-ready view on Microsoft Fabric and Power BI.
This recap is not a press-release victory lap. The useful point is the architecture pattern behind the demo, because the same pattern applies well beyond a conference booth. Many lab and operations teams are not short of systems. They are short of a trusted layer that connects those systems without forcing every platform to be replaced first.
If your team still reconciles spreadsheets to answer questions about QC, yield, batch progression or production readiness, the opportunity is not just a better dashboard. It is a clearer route from raw signals to decisions people can defend.
Where Power BI and Fabric meet the modern lab
Modern labs are under pressure to operationalise data at scale - a theme Future Labs Live Basel 2026 puts front and centre. The question is not whether to modernise the lab data stack, but how to do it without a multi-year rebuild.
That is where Microsoft Fabric and Power BI become genuinely useful in a lab context:
- OneLake as the lab data foundation
Shortcuts pull LIMS, ELN, ERP and instrument exports into one governed address space without forcing a migration off the systems you already use. The weekly CSV exchange disappears; the systems of record stay. - Real-Time Intelligence on Fabric
Eventstream, KQL databases and Reflex turn instrument and production line telemetry into live signals - QC excursions and yield deviations are flagged as they happen, rather than being discovered in the next morning’s report. - Power BI for lab and production decisions
Operational dashboards - throughput, yield, OEE, QC pass/fail, batch progression - shipped on the same governed model your data engineers and scientists use. - Copilot over governed data
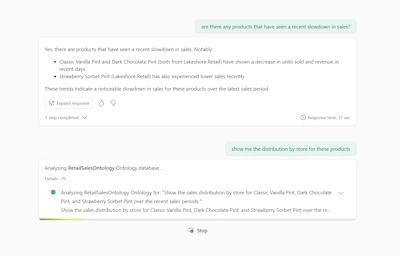
Natural-language questions answered from certified datasets, supported by ontologies and mapped business context.
What we brought to booth S13
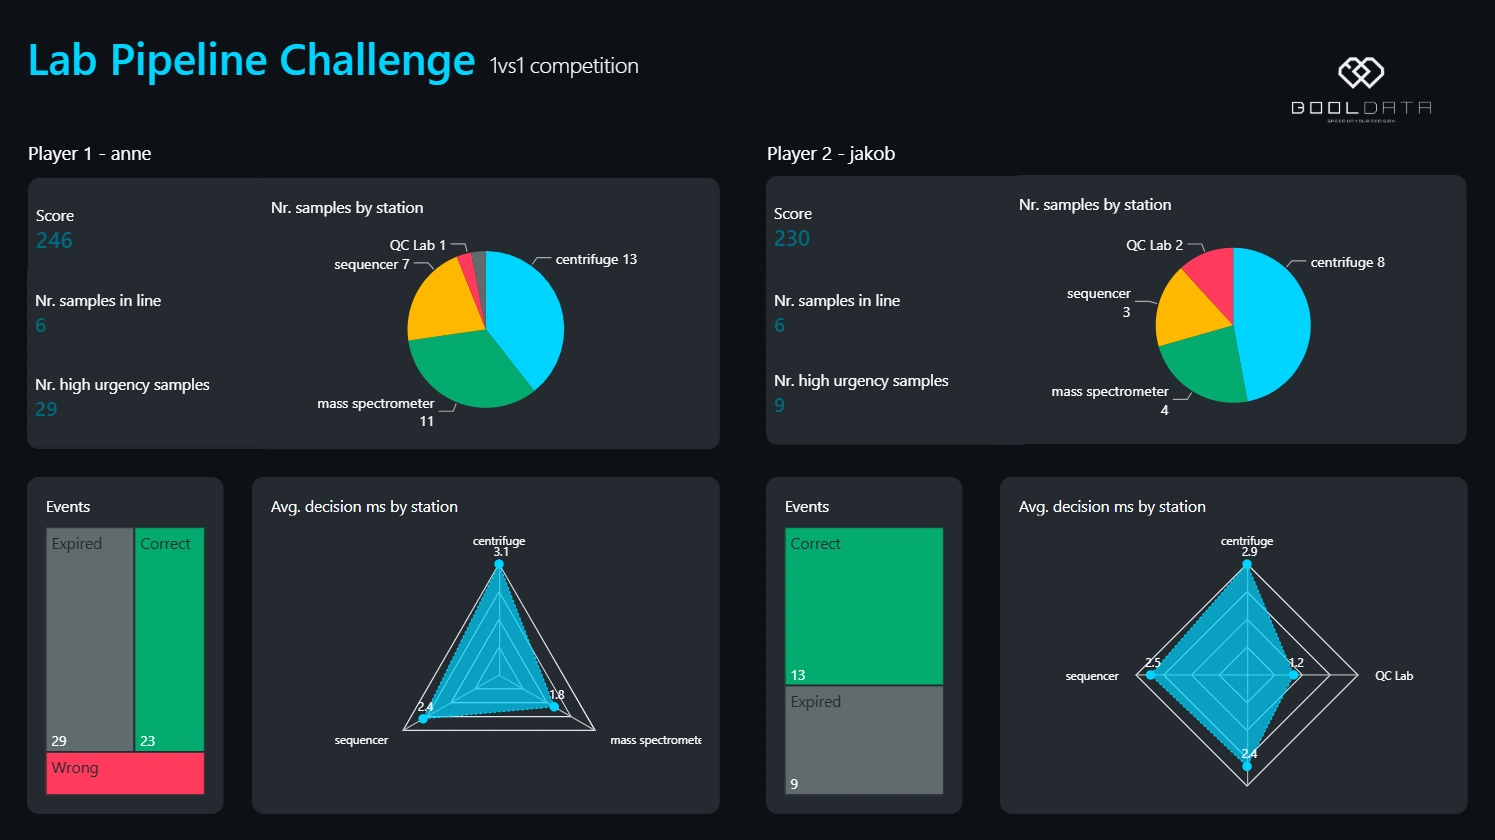
At booth S13 we ran a hands-on, real-time integration demo built directly on Microsoft Fabric. The demo streamed data into Fabric Eventstream, landed it in a Lakehouse and visualised it live in Power BI. End to end, the point was to make the flow visible: signal, ingestion, storage, model and decision layer.
The same pattern applies to QC measurements and production line signals: a decision-ready view lab and operations teams can act on as a deviation happens, not the morning after.
The pattern behind the demo
The strongest lab data architectures we see do not start by pretending every system can be standardised at once. LIMS, ELN, ERP, instrument software and production systems usually have different owners, release cycles and rules. Some are cloud-native. Some are deeply embedded. Some export clean APIs; others still depend on scheduled files.
The practical route is to build a governed data layer that can absorb that variety without turning it into a permanent mess.
In Microsoft Fabric, that layer usually has four parts:
- Connection layer: APIs, database mirroring, files, events or shortcuts bring data into the platform with the least invasive path that still meets governance needs.
- Lakehouse layer: raw and curated data are separated, documented and validated, so data lineage is visible and teams can trace how a metric was formed.
- Semantic layer: business definitions for batches, tests, lots, products, equipment and exceptions are modelled once, instead of being rebuilt in every report.
- Decision layer: Power BI turns those governed definitions into operational views, alerts and review packs that match the cadence of lab and production decisions.
That structure matters because most lab reporting issues are not caused by one missing visual. They come from a gap between system data and decision language. A QC manager might ask for pass/fail trends by method, product family or production shift. The raw systems might hold that information across multiple tables, naming conventions and exports. Without a semantic layer, every report becomes a local translation exercise.
Fabric does not remove the need for modelling. It gives the team one place to make that modelling explicit.
Why real-time is useful only when the context is trusted
Real-time dashboards are attractive, but speed alone does not make a decision better. A live signal is useful when the receiving team understands what it means, trusts where it came from and knows what action follows.
For lab and production use cases, that means pairing event data with business context:
- Which batch, lot, product or line does this signal belong to?
- Which quality rule or tolerance band applies?
- Is the data preliminary, approved or released?
- Who owns the exception, and what is the escalation path?
- Does the signal change a decision now, or does it simply add noise?
Those questions are why we keep returning to governed models. Eventstream, KQL databases and Reflex can move signals quickly, but the value comes when those signals are connected to the definitions the business already uses. Power BI then becomes more than a display surface. It becomes the place where operational teams can see what changed, why it matters and what to do next.
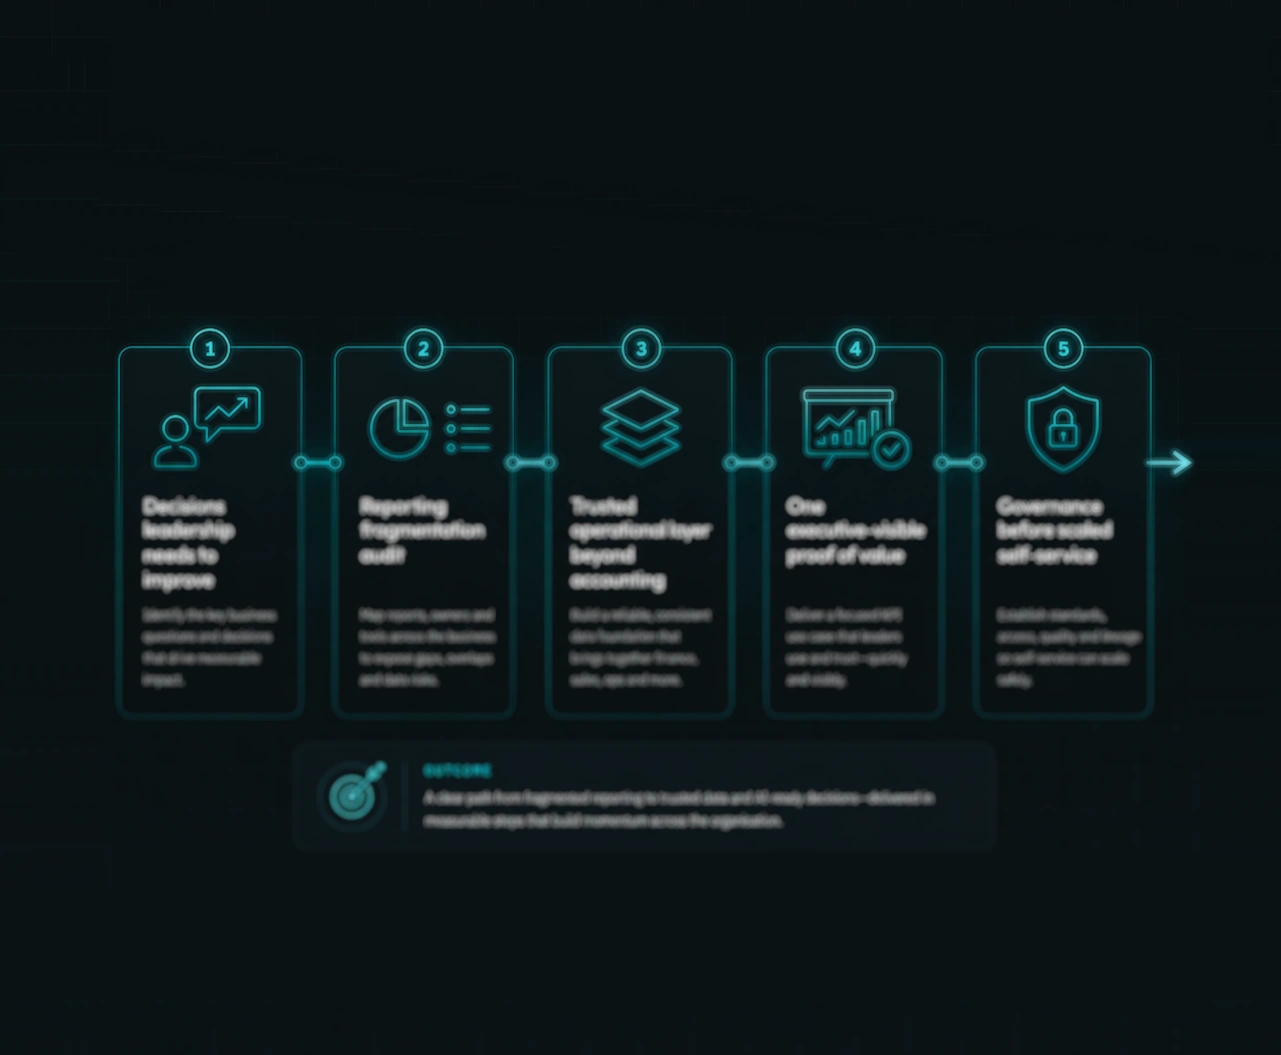
A sensible first scope after Basel
The first useful lab analytics block is usually smaller than teams expect. You do not need to model the whole lab estate to prove value. A focused starting point might be one product family, one QC process, one instrument group or one manufacturing line where delays already affect decisions.
For a first Microsoft Fabric block, we would usually scope:
- The decision cycle: what question needs a faster or safer answer?
- The source systems: which LIMS, ELN, ERP, instrument or file sources hold the required signal?
- The metric definitions: what counts as complete, failed, delayed, released or out of tolerance?
- The ownership model: who validates the numbers and who acts on exceptions?
- The operating view: which dashboard, alert or review pack becomes part of the weekly or daily rhythm?
That scope keeps the work concrete. It also gives sponsors a better basis for funding the next block, because value is attached to a decision rather than to a platform migration slogan.
What to validate before scaling
Before extending the pattern across more of the lab estate, we would validate three things.
First, the data contract. Teams need to know which fields are mandatory, which values are allowed and how changes in source systems are communicated. Without that contract, every new source adds interpretation risk. A Fabric lakehouse can hold the data, but the business still needs agreement on what the data means.
Second, the operating model. A dashboard that shows QC exceptions is only useful if the organisation knows who reviews it, how often, and what action follows. The Power BI layer should reflect that rhythm: daily checks for operational control, weekly reviews for trend analysis and monthly views for leadership decisions.
Third, the adoption path. Lab specialists, quality teams, operations leaders and data engineers do not need the same interface. Some need alerts; some need traceability; some need modelling access. The architecture should support all three without giving everyone the same responsibility. That is where governance becomes practical rather than theoretical.
Scaling works when those foundations are clear. Otherwise, the team risks moving from spreadsheet sprawl to dashboard sprawl, which is only a more modern version of the same problem.
After Basel
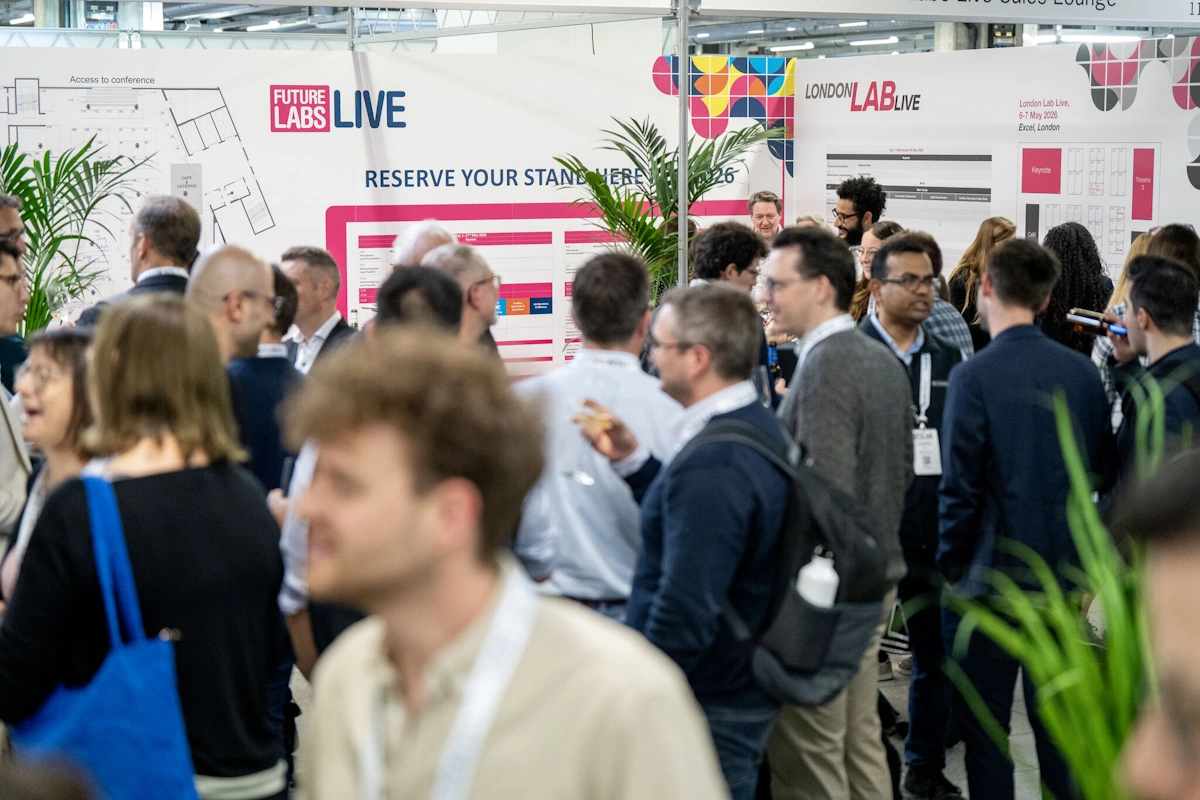
Future Labs Live Basel was a useful setting because it brought lab transformation, automation and data conversations into the same space. That mix matters. Lab analytics does not succeed as a reporting side project; it succeeds when data engineering, process ownership and scientific context are designed together.
For teams on Microsoft licensing, Fabric and Power BI offer a simplified path because they can connect operational data foundations with the analytics layer people already know. The work still needs careful modelling, governance and adoption. The difference is that the first useful block can be built without waiting for a multi-year platform reset.
Talk through your lab data stack
If this pattern is relevant to your lab, quality or operations team, we would like to hear how you currently get from raw signals to confident decisions, and where that path is still slower than it should be.
Whether the starting point is LIMS reporting, instrument data, batch visibility, QC exception tracking or production readiness, get in touch and we will happily walk through your stack with you.